
Unlocking Potential TOK Commercial’s 2025 Annual Report
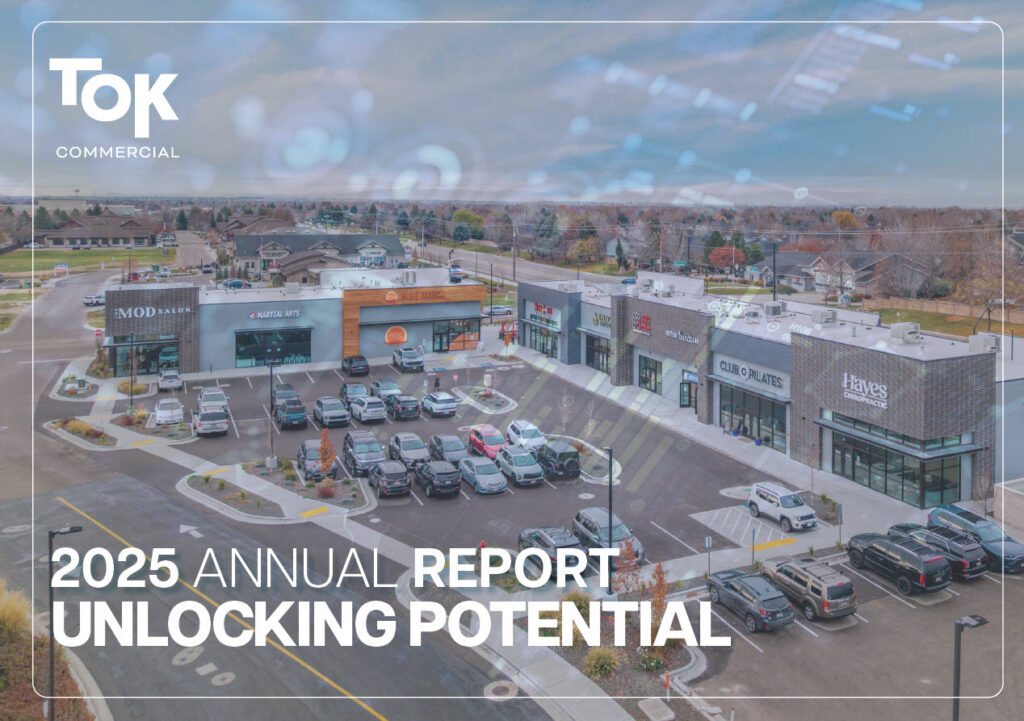
ANNUAL REPORT | 2025 WELCOME! In 2025, TOK Commercial focused on unlocking potential within our clients’ portfolios, our markets, and our own organization. As the commercial real estate landscape continued to evolve, we embraced change as an opportunity, applying insight, agility, and experience to help our clients move from possibility to performance. PERFORMANCE, POWERED BY […]
Retail Construction Trends

BOISE MSA | Q3 2026 RETAIL MARKET REPORT CONSTRUCTION TRENDS New retail construction has moderated compared to last year, helping keep vacancy rates in check. Through the second quarter, approximately 91,200 square feet of retail space had been delivered, down from nearly 156,000 square feet during the same period in 2025. Speculative development also declined, […]
Retail Vacancy Trends

BOISE MSA | Q3 2026 RETAIL MARKET REPORT RETAIL VACANCY TRENDS Across the Boise Valley, the Caldwell Boulevard submarket has posted the strongest absorption in 2026, North Meridian continued to record the highest volume of retail deals. North Boise, Downtown Boise, and Eagle also experienced healthy tenant demand throughout the first half of the year. […]
Retail Tenant Origin

BOISE MSA | Q3 2026 RETAIL MARKET REPORT RETAIL TENANT ORIGIN Leasing activity remains driven primarily by existing businesses expanding within the market, with 45 percent of tenant activity over the past 12 months coming from retailers opening additional locations. Although most deals remain concentrated among smaller users, larger-format retailers continue to play an important […]
Retail Absorption Trends
BOISE MSA | Q3 2026 RETAIL MARKET REPORT RETAIL ABSORPTION TRENDS The Boise MSA retail market remained healthy through the second quarter of 2026, supported by strong tenant demand, limited available space, and several large lease transactions. Net absorption reached 282,000 square feet through the first half of the year, a significant improvement from the […]
Investment Boise Cap Rates

BOISE MSA | Q3 2026 INVESTMENT MARKET TRENDS BOISE CAP RATES Financing conditions continued to shape investor underwriting and pricing. The 10-year Treasury yield ended July at 4.8 percent, keeping borrowing costs elevated and maintaining pressure on cap rates. Average retail cap rates remained stable at 6.1 percent, consistent with both last year and the […]
Investment Sales By Property Type

BOISE MSA | Q1 2026 INVESTMENT SALES BY PROPERTY TYPE In total, six industrial deals, six multifamily deals, along with three retail deals exceeded the $10 million threshold in 2025. In total, 118 disclosed investment transactions closed during the year, up 10 percent from 2024. Retail led all sectors with 36 percent of total deals, […]
Investment Sales Volume Trends

BOISE MSA | Q3 2026 INVESTMENT MARKET REPORT INVESTMENT SALES VOLUME Transaction volume also increased, signaling broader market participation. A total of 55 investment sales closed through June, up 19 percent from the first half of 2025. Retail remained the most active sector with 22 sales, followed by office, industrial, and multifamily. SALES VOLUME ended […]
Industrial Construction Trends

BOISE MSA | Q3 2026 INDUSTRIAL MARKET REPORT INDUSTRIAL CONSTRUCTION The Boise MSA’s speculative industrial development remains very active, with approximately 710,000 square feet delivered through June 2026, led by projects including High West Business Park, Boise Gateway Building 4, and 2546 Fry Street, all located in South Boise. While much of this new inventory […]
Industrial Net Absorption
BOISE MSA | Q3 2026 INDUSTRIAL MARKET REPORT INDUSTRIAL NET ABSORPTION The Boise MSA industrial market remained healthy through the second quarter of 2026, supported by strong tenant activity and a significant increase in occupied space. Net absorption totaled nearly 1.8 million square feet, up substantially from 481,000 square feet during the same period last […]